March 11, 2014
Map of the U.S
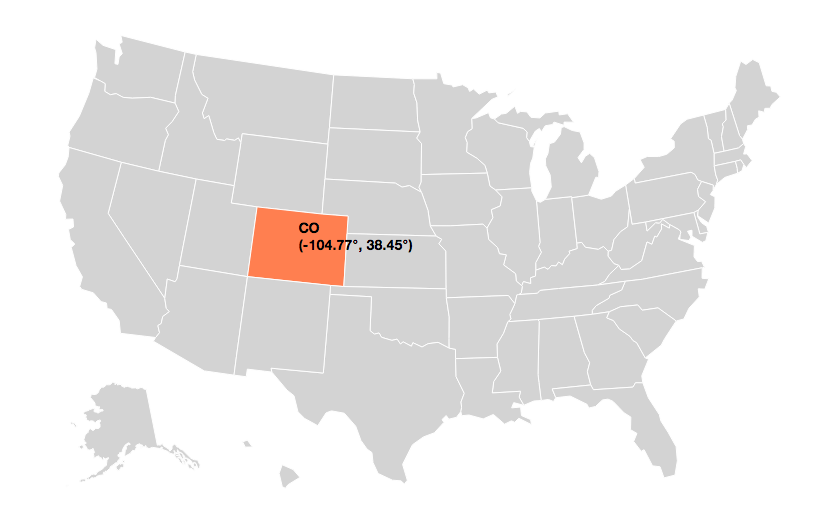
A simple demonstration of TopoJSON and interactivity. Mouseover to show the state's abbreviation and the latitude and longitude of the point.
Visualization
In addition to D3, this visualization relies on TopoJSON. The map uses an Albers USA projection, for which Alaska is scaled by 0.35x, giving it a lie factor of 3. On mousemoves, the corresponding state abbreviation in the data is shown, and the latitude and longitude is computed by inverting the mouse position.
var width = 840,
    height = 500;

var projection = d3.geo.albersUsa()
    .scale(1000)
    .translate([width / 2, height / 2]);

var path = d3.geo.path()
    .projection(projection);

var svg = d3.select("svg")
    .attr("width", width)
    .attr("height", height);

d3.json("us2.json", function(error, us) {
  svg.selectAll(".state")
      .data(topojson.feature(us, us.objects.usStates).features)
    .enter()
      .append("path")
      .attr("class", "state")
      .attr("d", path)
      .on("mouseover", function() { focus.style("display", null); })
      .on("mouseout", function() { focus.style("display", "none"); })
      .on("mousemove", function(d) {
        var pos = d3.mouse(this),
            latlng = projection.invert(pos);
        focus.select(".abbr").text(d.properties.STATE_ABBR);
        focus.select(".latlng").text("(" + d3.round(latlng[0], 2) + "\u00B0, "
                                         + d3.round(latlng[1], 2) + "\u00B0)");
        focus.attr("transform", "translate(" + pos[0] + "," + pos[1] + ")");
      });

  var focus = svg.append("g")
      .attr("class", "focus")
      .style("display", "none");

  focus.append("text")
      .attr("class", "abbr")
      .attr("x", -10)
      .attr("y", -30)
      .attr("dy", ".35em");

  focus.append("text")
      .attr("class", "latlng")
      .attr("x", -10)
      .attr("y", -13)
      .attr("dy", ".35em");
});
